Eugene Babaev "Intuitive Chemical Topology Concepts" (c)3. Explicit Concepts of Molecular TopologyThe above set of visual topology concepts may enable us to check whether the terms "molecular graphs" and "molecular surfaces" are well-defined from the topological viewpoint. What is the precise meaning of a cycle in a molecular graph and of a hole in a molecular surface? Finally, what is (or what could be) the meaning of the homeomorphism concept for chemical structures?
3.1. Classical Chemical Models
Molecular graph. In a common sense a molecule may be considered as a set of points in the space R3 (atoms) connected by lines (interatomic bonds). This picture intuitively resembles a graph (in the sense of a graph embedded in R3). Classical chemical structures drawn on paper or on a computer display may be treated as graphs embedded in plane R2, although the points are not always visible and are frequently masked (labeled) by symbols of chemical elements. The edges may also be labeled (dashed or bold) to simulate outward appearance of a molecule as the geometrical object in R3.
This picture is explicit only if an edge represents the localized bond (two-electron and two-centered bond), for instance, in the case of saturated hydrocarbons [61] of general formula CnH2n+x (x £ 2). Consider the family of acyclic hydrocarbons (x = 2, alkanes) and alicyclic hydrocarbons (with ordinary cycles of size 3 and higher). For this class of compounds the concept of connectedness is certain: the connected molecular graph and disconnected set of K components are easily distinguishable, since an edge is assigned to only strong CC or CH intramolecular bonds, and the existence of weak intermolecular bonds may be neglected. Since valencies (for carbon 4 and for hydrogen 1) are not variable, the fundamental formulas (1) and (2) for the cyclomatic number of an abstract graph are equally valid for a molecular graph. The number of vertices V = N (N is the total number of atoms), and the number of edges E = Z/2 (Z is the total number of valence electrons), since the electrons are grouped in pairs. Hence, the cyclomatic number for the series CnH2n+x follows equation (8a) and may be expressed as the balance between the number of localized bonds and number of atoms:
(8a) C = E - V + 1 = (Z/2) - N + 1,
For the series CnH2n+x, we have Z = 6n + x, N = 3n + x. Therefore
(8b) C = 1 - x/2
Hence, the cyclomatic number of a molecular graph is independent of n value, and the value x should be even. It is clear why x £ 2: the case x = 2 is the series of alkanes (the graphs are trees, C = 0), and the cases x>2 correspond to disconnected sets of hydrocarbons. The matching is perfect, and x (the deficiency or excess of hydrogen atoms) is known as the degree of saturation.
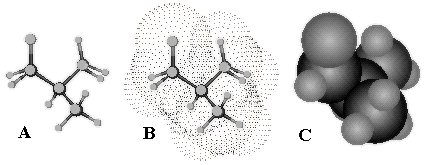
Molecular surface. A formal 3D body with a well-defined 2D boundary may be assigned to a molecule. The 2D boundaries appear in various molecular models, say, in the space-filling models, in the van der Waals (frequently abbreviated to VDW) surfaces, and even in the classical ball-and-stick models made of various solid materials (Figure 8).
Figure 8. Typical visualization of classical 2D molecular models in software programs. Ball-and-stick model (A), Van der Waals 2D surface (B) presented by dots, and space-filling model (C) of 2-methylpropane molecule.
Such 2D models are widely used in chemical practice, education, and scientific publications, and various tool-kits for molecular modeling are described in literature [54-60] and commercially available (see, e.g., a list of suppliers [61]). It is commonly implied that 2D boundary of any solid 3D model is a closed and orientable 2D surface, that falls into the definition of 2D manifold. At the present state of art, 2D surfaces may be quickly calculated and visualized on the computer display with the help of various computer software programs.*)
*) An overview of molecular surfaces and software programs for their visualization in now available in the World Wide Web, see the web page [63]. (For citing the electronic information one may refer to the book [64]).
The shift from a graph to a surface is regarded to be trivial: points should be substituted by overlapping van der Waals spheres of certain diameters, and the external surface around 3D body is the desired 2D molecular surface. Furthermore, this mapping is also considered reversible and one-to-one. Thus, in many software programs, one may click a mouse in menu option to switch from a graph to an appropriate 2D model and reverse.Therefore, the mapping of a graph to a 2D object is usually not a problem in molecular 2D modeling. Rather, the common problems are related to the manner of visualizing a 2D model on the computer display, like seeking better shading algorithms or making a VDW surface smooth [65, 66]. Here, there may be a confusion. Thus, it is convenient to represent the surface of a large biomolecule by the solvent accessible surface [67], rigorously defined as a trace of a probe sphere rolling around VDW surface [68, 69]. However, a rolling sphere can mask a cavity (hole) in the initial VDW surface, and the final 2D object from topological viewpoint may be another 2D surface.
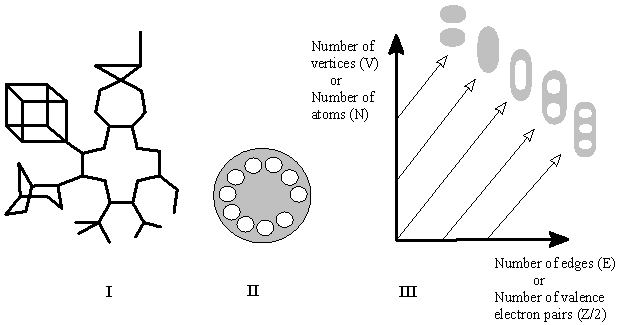
Homeomorphism in CnH2n+x series. Intuitively, any monocyclic hydrocarbon molecule (with ordinary cycle in its molecular graph), presented at the level of 2D models, has a surface homeomorphic to a torus. This is not true for the solvent accessible surfaces (the trace of rolling sphere could mask a hole in the VDW surface), however this is correct for the space-filling, VDW, and ball-and-stick models. Therefore, these three types of 2D models of polycyclic hydrocarbons CnH2n+x have more or less pronounced holes, whereas 2D surfaces of alkanes have no holes at all. Of course, every hole in 2D surfaces appear from a cycle in molecular graphs, namely, a torus appears as a cyclic sequence of overlapping VDW spheres. It is easy to conclude that the genus of the 2D surface of the hydrocarbon CnH2n+x is equal to the cyclomatic number of a parent molecular graph. This may be proved, considering a mapping between the molecular graph of a hydrocarbon and the 2D surface of its a ball-and-stick model, that is actually a "solid" model of a graph.
The equality of the genus (for a 2D surface) and the cyclomatic number C (for a graph) for the series CnH2n+2 opens the possibility for calculating the Euler characteristic in terms of the balance between electrons and atoms. Let us combine equation (7) for the genus of surfaces SC and the balance equation (8) for hydrocarbons and arrive at (9a):
(9a) c = 2 - 2C = 2 - 2[(Z/2) - N + 1] = 2N - Z
By expressing Z and N for series CnH2n+x with the numbers n and x, we get (9b):
(9b) c = x
Hence, the index x is nothing else but the Euler characteristic of the 2D surface of hydrocarbons. Thus, the surface of 2D model of any alkane CnH2n+2 is a sphere (c = x = 2). The surface of any cycloalkane CnH2n is a torus (c = x = 0). Generally, the surface of any polycyclic hydrocarbon CnH2n+x is a sphere with C handles (c = 2 - 2 C = x). For disconnected sets equation (9a) should be rewritten as:
(9c) c = x = 2K - 2C = 2N - Z
The case x>2 is impossible for a connected surface SC (for which c can not exceed 2, see Section 2.4). Thus, for the "hypersaturated" class CnH2n+4 any molecule should immediately fall into disconnected set of two molecules, each with the spherical surface from the CnH2n+2 class (cf. equation C2H8 = CH4 + CH4).
Evidently, when applied to hydrocarbons the homeomorphism concept turns out to be the very old chemical concept of CH2 homology: within the class of given x, the structures are homeomorphic. Of course, the genus does not distinguish the geometry or the shape of objects. Therefore, any geometrical isomers, stereoisomers, and even branched or linear structures are homeomorphic. The genus is also insensitive to the size (of a chain or a cycle). Therefore, 2D models of methane and polyethylene (saturated on the ends of the chain) are topologically indistinguishable.
A chemist may guess, what the homeomorphism is actually like: it is the order of arranging hydrocarbons in the famous and commonly used Beilstein handbook (which was first published at the end of the last century!) [70]. The statement about homeomorphism is, therefore, an explication of intuitively trivial idea, namely, similarity in homological series. This is a good sign, because it means that there exists a nice reference point to which any uncertain case of homeomorphism in molecular models may be related. Let us keep this result in mind (because it will be useful in further Sections) and express the interrelations of (molecular) graphs and surfaces in visual form (Figure 9).
Figure 9. (I) A molecular graph of a polycyclic hydrocarbon with the cyclomatic number of ten (hydrogen atoms are omitted). (II) 2D surface assigned to this graph is homeomorphic to the surface of a telephone disk with the genus of ten. (III) Graphical visualization of formulas (3), (7), (8a), (9a) as interrelations between indices of abstract graphs (V, E) and surfaces (C, K), and between molecular graphs (Z, N) and surfaces (C, K) for (cyclo)alkanes. Diagonal lines correspond to arrangement of isocyclic (molecular) graphs with homeomorphic (molecular) surfaces.
3.2. Graphs and Surfaces in Physical Models
In contrast to this clear picture of classical chemistry, the pure quantum chemical viewpoint is the opposite: the molecule is neither a graph nor a surface. It has neither a precise 2D boundary, nor definite features to which 1D elements (bonds of a graph) may be assigned. Even the arrangement of the nuclei (the prototypes for vertices of a graph) is uncertain, because they also obey principles of quantum mechanics. Instead of a graph or a surface, a diffuse 3D body with an fuzzy boundary serves as a purely physical image of a molecule. Of course, even very clear topological concepts of connected and disconnected sets look somewhat vague within such a model.
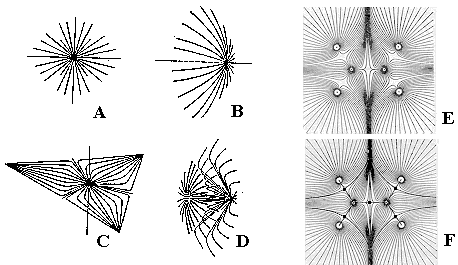
Molecular graphs in physical models. Nevertheless, it is possible to reconstruct the familiar concepts of a molecular graph and a molecular surface from the quantum-chemical model, although each time we need such a graph or a surface, some calculations should be carried out. According to the approach of Bader [71 -- 73] molecular graphs may be "extracted" from the 3D picture of charge density as follows. The topology of charge density r(r) may be characterized by its gradient Ñr(r), which, in turn, allows the discrete combinatorial description. The properties of r(r) (which is the scalar field in R3) are totally determined by the number and nature of its critical points, i.e., the points at which the field vanishes. There are only four types of such critical points, and they correspond to local maxima, two types of saddle critical points, and local minima (see Figure 10).
Figure 10. Visualization of critical points by the pattern of trajectories traced out in their neighborhood by the gradient vectors. A: local maximum (3,-3); B: saddle point (3,-1); C: local minimum (3,+1); D: saddle point (3,+3). The first number in brackets (always 3) is the rank of a critical point (the number of nonzero eigenvalues of the Hessian matrix); the second value is the signature of the critical point, that is, the excess of positive values over negative ones. E: arrangement of trajectories for a molecule. F: design of a bipartite graph from points (3, -3) and (3, -1). Reproduced with kind permission of Professor R. F. W. Bader.
As proven by calculations, local maxima (3,-3) always appear at the position of nuclei. Saddle points (3,-1) are located in the "bond path," a line that connects two local maxima. Therefore, these two types of critical points may correspond to the vertices and edges of a molecular graph. Fortunately, the (3,-1) saddle points are found to appear just at those pairs of atoms that are presumed to be bonded in the chemical sense. In addition, saddle points (3,+1) may be found inside rings (formed by bond paths connected three or more nuclei), and the remaining local minima (3,+3) -- inside cages (formed by four or more nuclei and bounded by at least three cycles). The molecular graphs obtained for molecules with localized bonds (e.g. of saturated hydrocarbons CnH2n+x with large cycles), are usually isomorphic to the conventional graphs. Furthermore, certain graphs may be attributed to molecules with delocalized bonds, for which drawing a graph within classical models is impossible. It is worth noting that Bader’s graphs are usually drawn as bipartite graphs, because any edge (connecting vertices that are local maxima) is subdivided by a vertex, that is, (3,–1) saddle point.
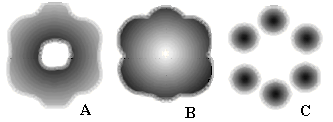
Molecular 2D surfaces in physical models. Molecular 2D surfaces (of various types [16, 28, 63, 74, 75]) can also be extracted from physical models of molecular structures. The key idea of most methods is to take a 3D function F(r) and consider the contour surface F¢ (A) = {r: F(r) = A}, where the function F(r) is equal to some specific parameter value A. For instance, the function F(r) may be the electronic charge density r(r). In the general case, the set F’(A) defined in such a manner is a 2D surface (isodensity surface) that surrounds all those points where the electronic charge density is higher than the selected value A. Of course, an accurate choice of the value A may result in the appearance of a closed connected 2D object that resembles familiar molecular surfaces (like VDW surface). In particular, one may visualize the toroidal structure of a monocyclic molecule (say, of cyclohexane) by fixing the scanning parameter of the contour surface (see Figure 11A), whereas in n-hexane no such hole can be found at all. The operation seems valid for the general case of the series CnH2n+x with large cycles.
Figure 11. Schematic representation of a cyclic molecule by a set of nonhomeomorphic contour surfaces with respect to the value of scanning parameter F’(A) = {r: F(r) = A}. For a monocyclic molecule, a toroidal surface (A) may collapse to a sphere (B) or vice versa, diverge into a disconnected set of spheres (C).
The obvious difference of this quantitative approach from classical qualitative 2D models is that the genus (and even connectedness) of molecular 2D surface thus obtained is a relative rather than absolute property. For small values of A (deficiency of electron density) the isodensity surface becomes a loose, essentially spherical balloon surrounding all nuclei (Figure 11B). Therefore, the topological difference between cyclic and acyclic molecules (that are intuitively not homeomorphic) disappears. For large values of A (excess of electron density) the contour surface is represented by a disconnected set of several essentially spherical surfaces, each surrounding one nucleus (Figure 11C). Similar results may be obtained if the function F(r) is the molecular electrostatic potential [28, 63]. Here, the parameter A may have both positive and negative values. Therefore, in some cases the surface may not be closed and/or only portions of molecular entity are displayed by contour surfaces. An important aspect of utilizing contour surfaces is the study of the arrangement of convex and concave domains with the tools of algebraic topology [28]. This problem is important and relevant to molecular recognition.
The representation of a molecule by a set of contour 2D surfaces instead of one surface is an interesting concept of chemical topology; one may study the abrupt changes in molecular topology varying continuously the scanning parameter A. However, the dependence of the fundamental topological properties -- like connectedness and cyclicity -- on some artificial empirical parameter A (used to obtain the contour surfaces) seems to be distant from the problems where the homeomorphism concept may be fruitful.
A specific sort of 2D models appears in molecular orbital (MO) theory [76, 77]. The electron wave function (and signs assigned to its parts) has only indirect physical meaning, nevertheless a contour 2D surface may be defined in a usual manner (for a fixed value of a parameter A) for any molecular orbital. Although 2D contour surface of a separate MO does not represent the entire molecular surface, some important MOs (like frontier orbitals essential from chemical viewpoint) may be homeomorphic for different molecules. The topic is extensively reviewed [17, 18, 75 -- 79] but will be outside of the scope of this article because of the following reason. The picture of essentially delocalized MOs is poorly compatible with the classical picture of localized bonds (which forms the background of the molecular graph concept). A graph may serve as an input for calculating the properties and topology of MOs (say in the Huckel method [80, 81] or in the model of localized orbitals [82 -- 85]). However, only an indirect image of a graph can be reconstructed from an orbital (or from the complete set of MOs). The cyclomatic number of molecular graph, therefore, is not a concept of MO theory.


